HydroMetrics Workout Scores
Data Visualization
The only thing more powerful than data is the ability to distill it into what matters most. Hydrow’s experience has always provided many data points about your rowing workout. Over time, our members have expressed interest in a system that can analyze all the data from their row and provide insight into what went well and how they can improve.

HydroMetrics is the solution to this need. Examining everything from your workout down to individual strokes provides an incredible amount of context for how you can make your rows even better.

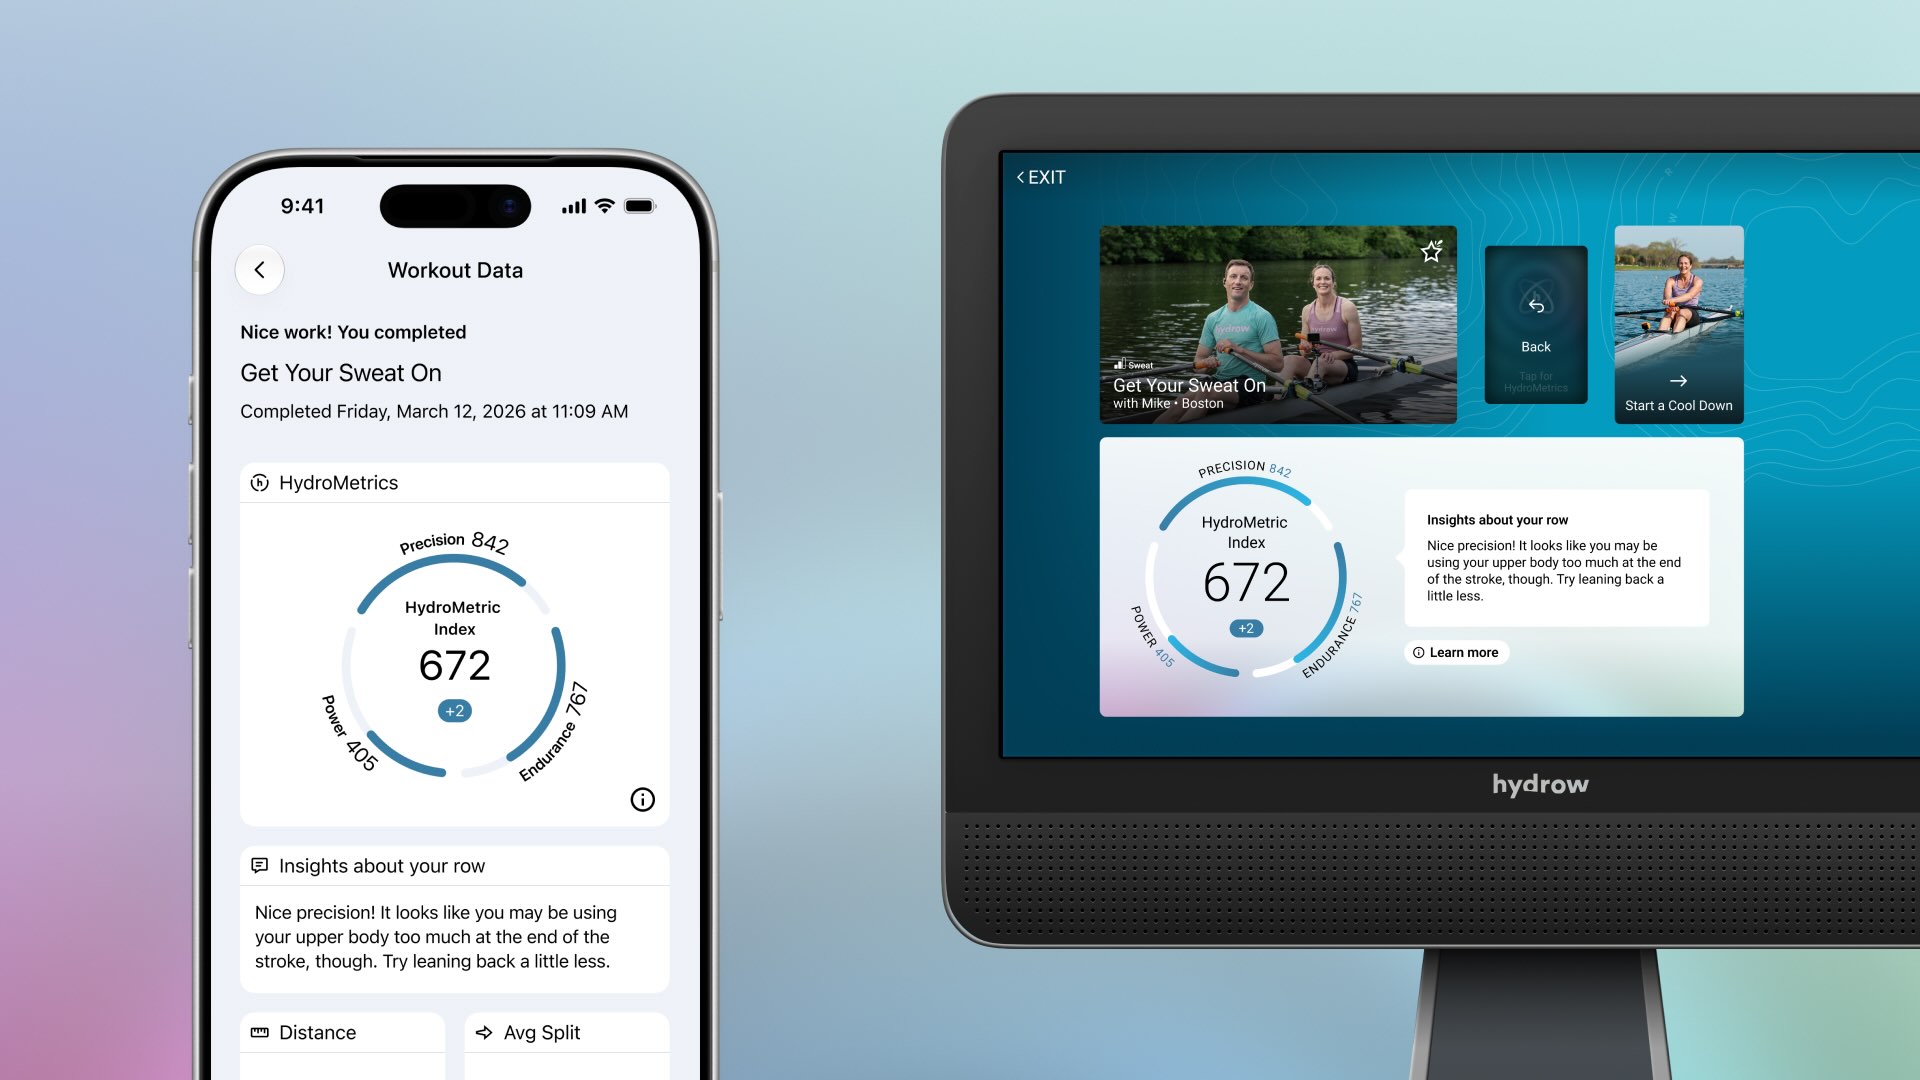
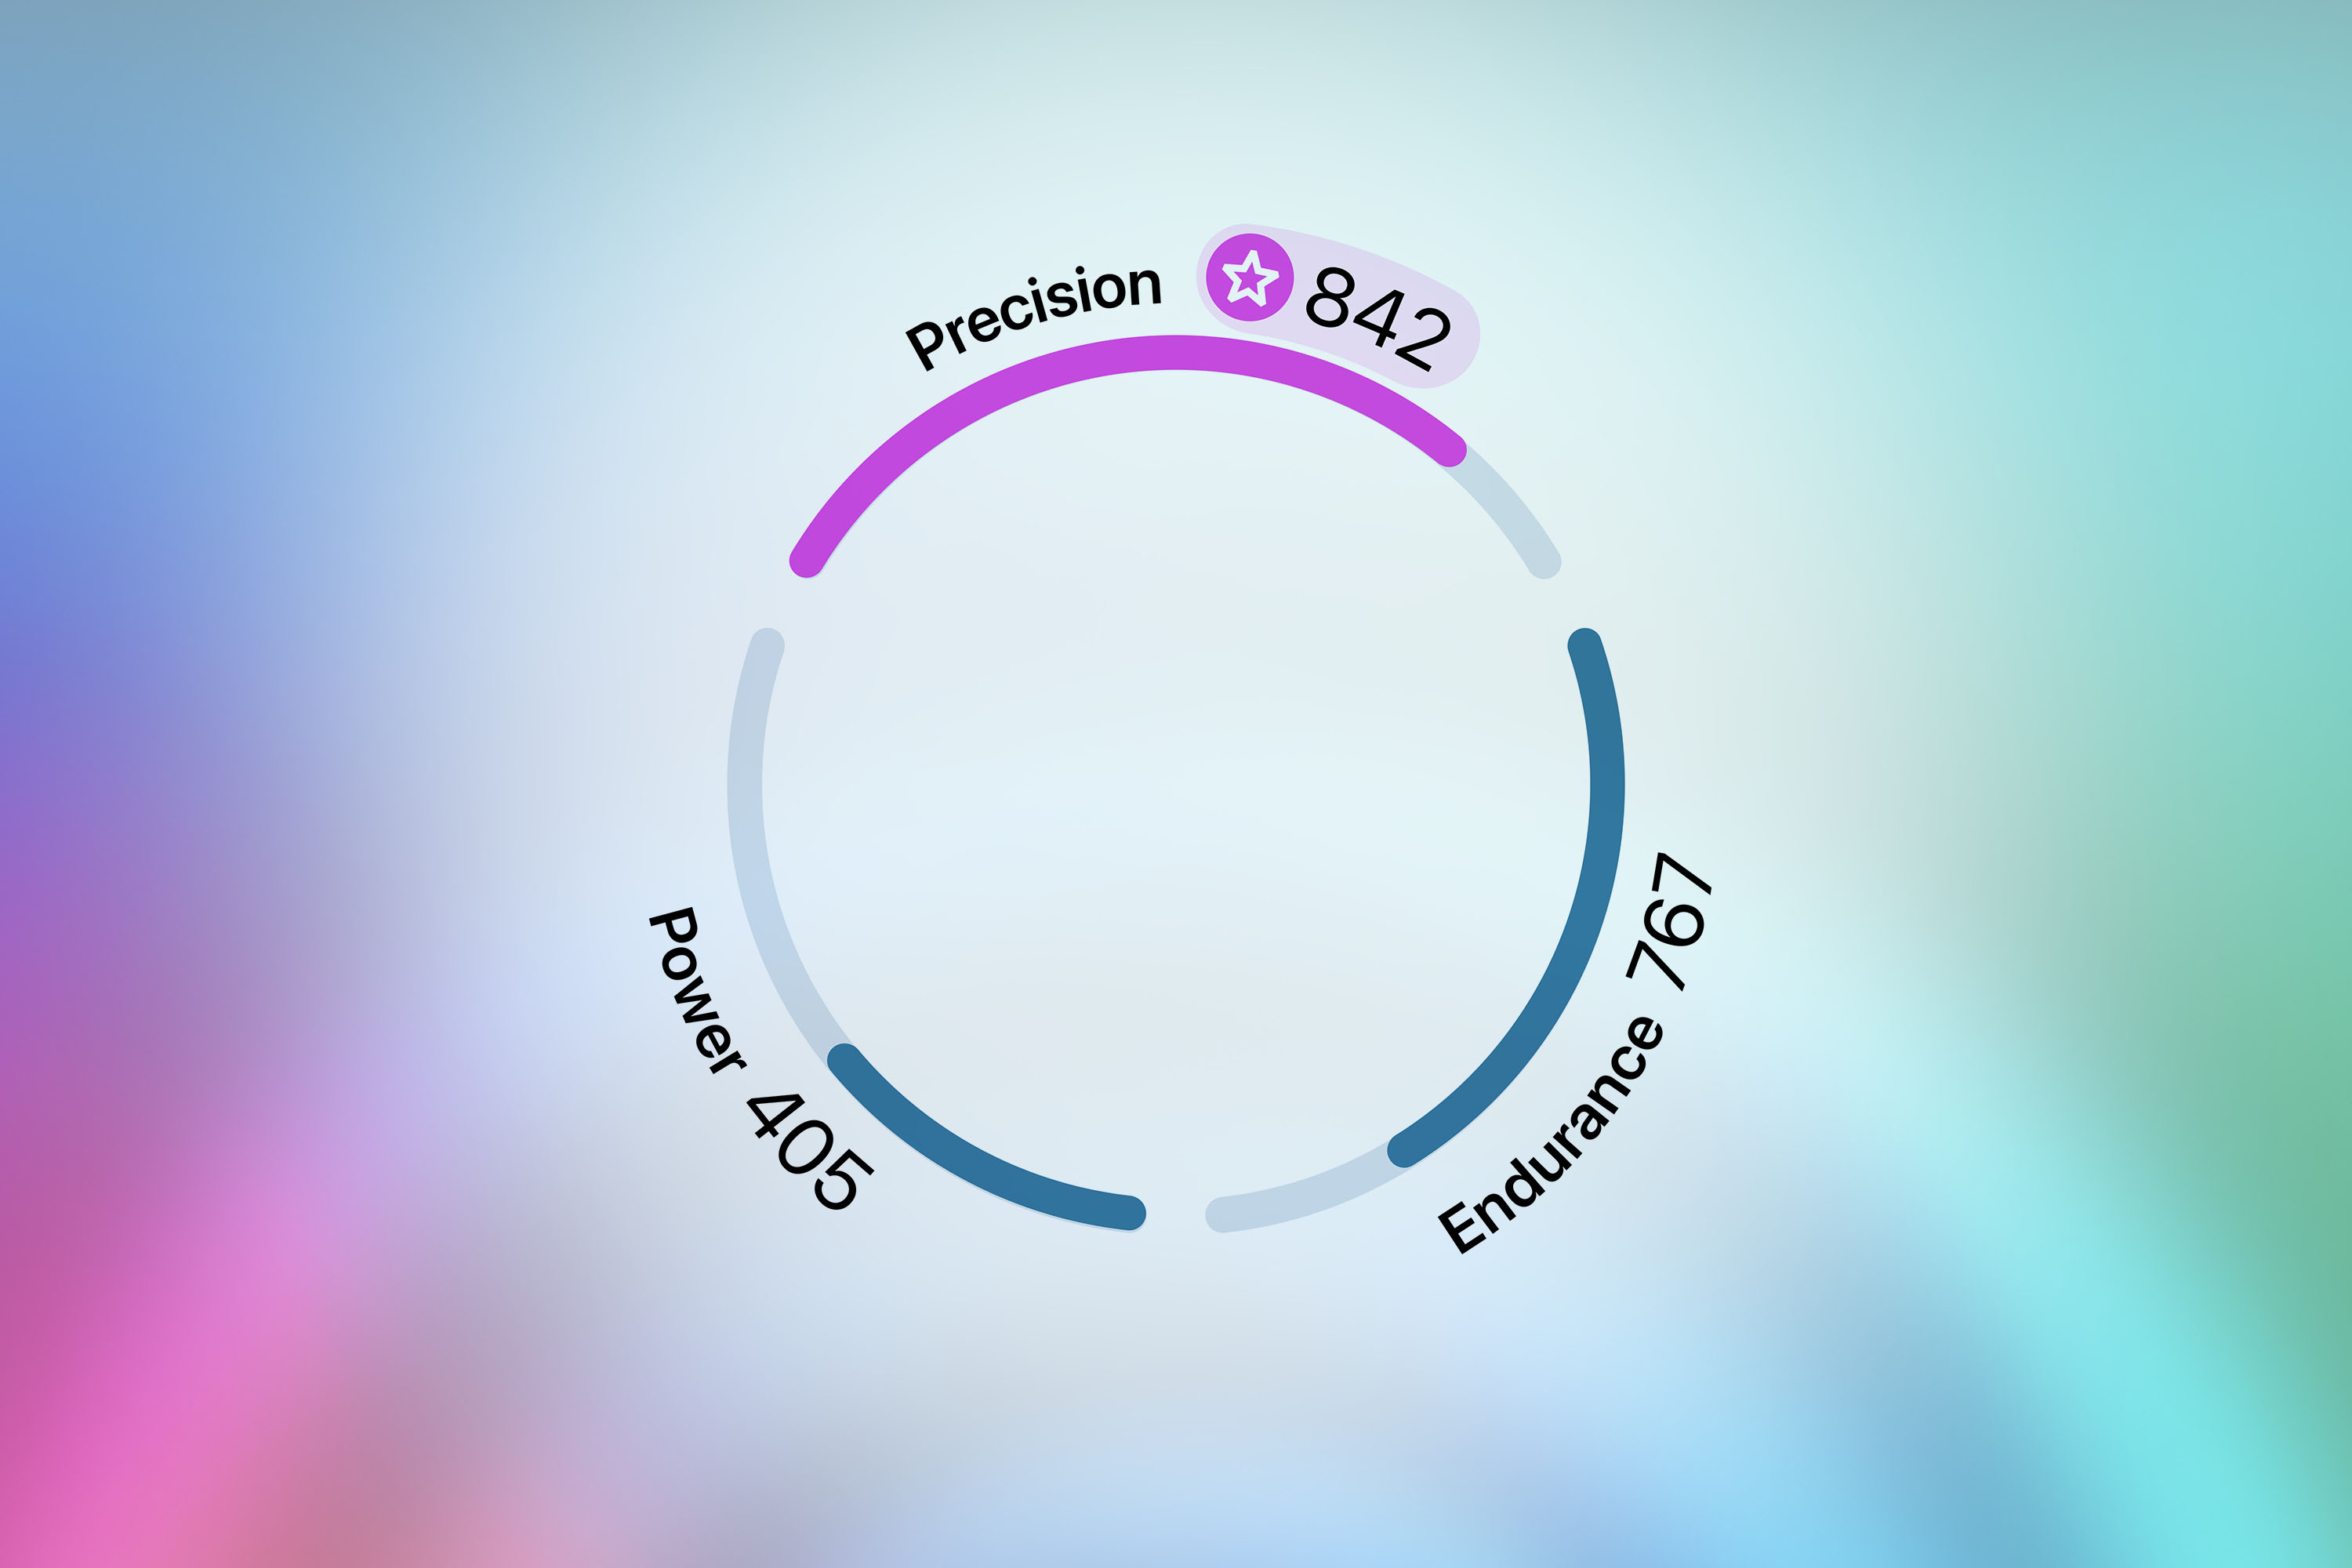
HydroMetrics is made up of four main components. Precision analyzes your rowing form and compares it against the ideal stroke. Power represents how much energy you expend during a workout. Endurance measures how much your body can withstand the specific intensity of your row. These scores combine into one primary score: The HydroMetric Index—a rolling score over the past 30 days that can be used to track performance over time.
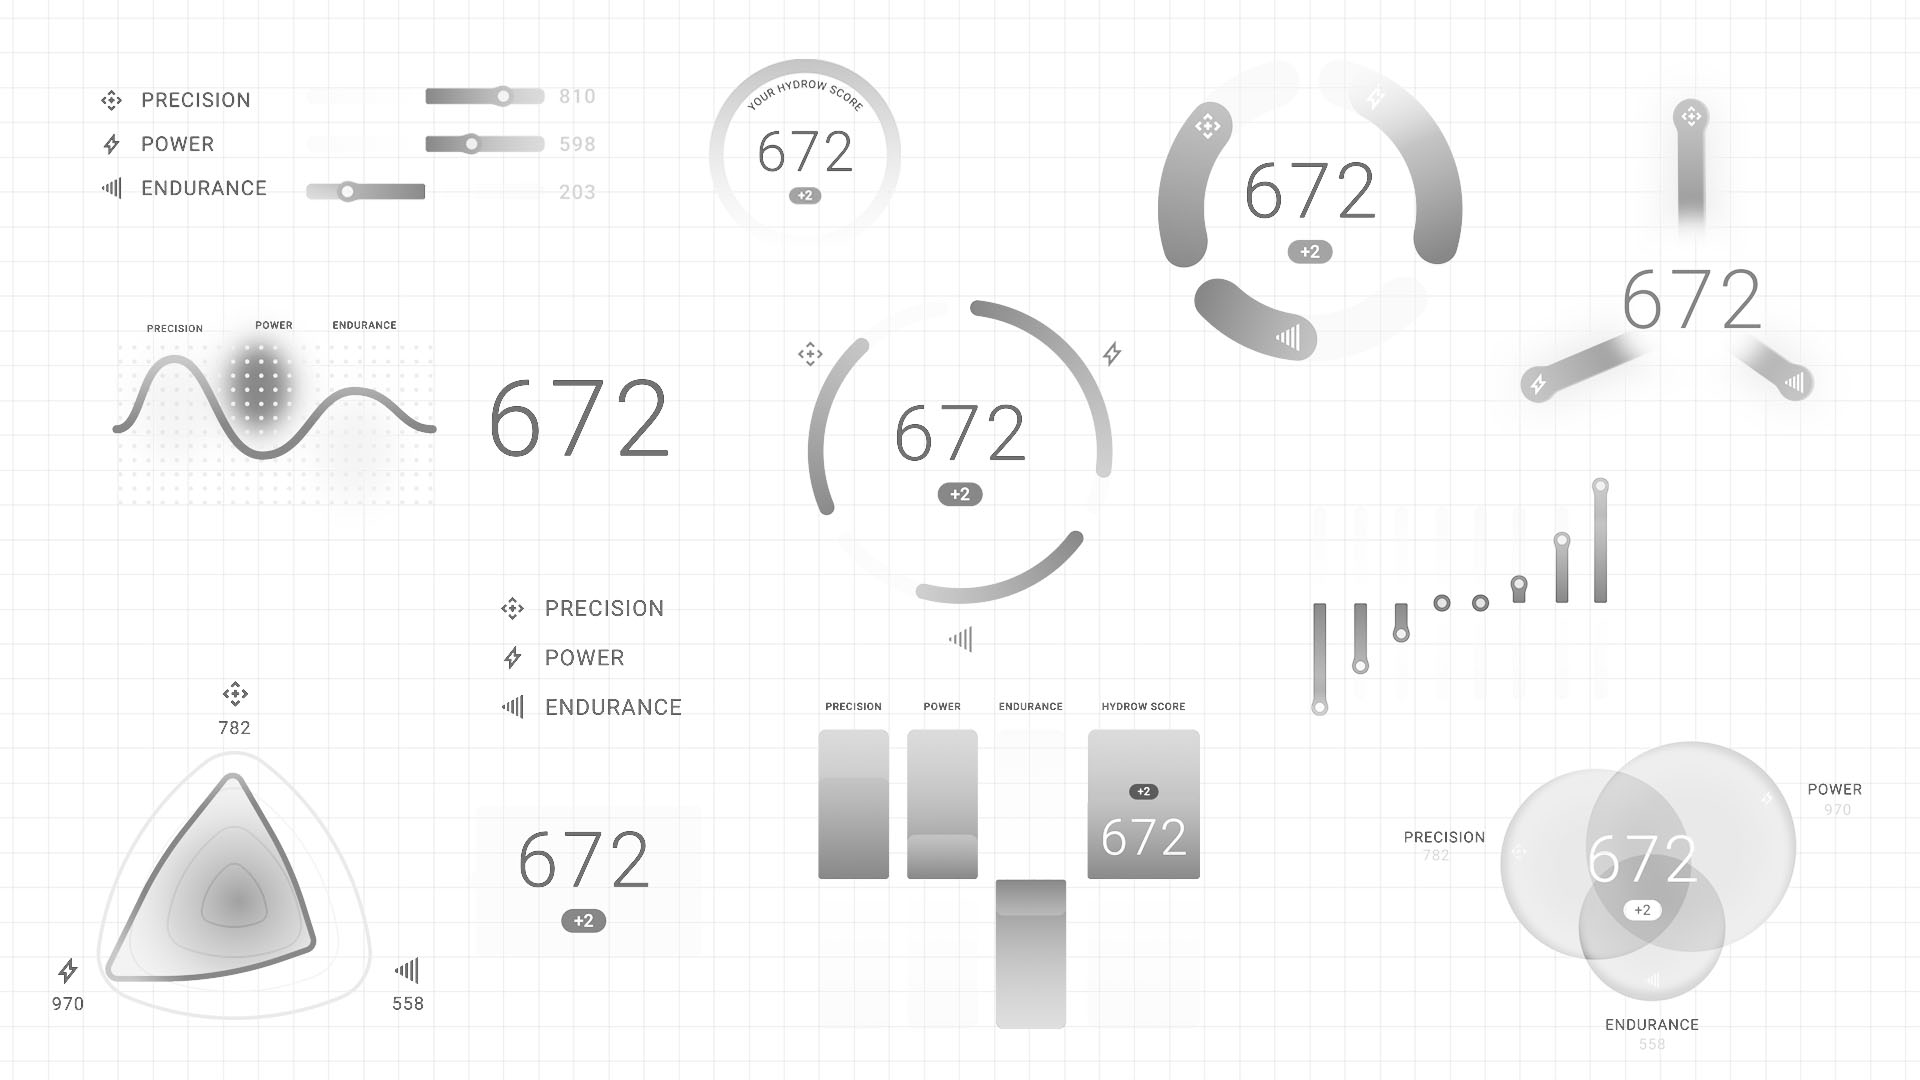
Creating a data visualization that was both understandable and recognizable required many rounds of revisions and edits. We explored virtually all approaches to representing the data to ensure we landed on the most harmonious solution.
HydroMetrics are displayed right on your rower after a workout. They are also accessible on your mobile device to view historical scores, compare with rows over time, and reread the written insights about your form.